How we do it

Every business is different and has its own peculiarities. We divide these particularities into processes, and we gather the processes into workflows. The workflows, put in a picture, result in the activity of the company. For example, a software company can be defined by employment flow, development flow, production flow, sales flow, and administrative flow. Of course, these workflows communicate with each other and in turn, each of them contains work processes.
What about standards?
We are using standard BPMN (https://www.bpmn.org/) and ANSI standard flowchart in order to provide initial business analysis.
After analyzing each process of interest in our project, we can move on to the analysis of the application modules or the system to be developed, integrated or implemented.
Thus, after knowing the whole project in detail, we can move on to its construction and to the next stage represented by the project analysis and its description.
How do you express yourself?
For Business Analysis step, we use standard frameworks such as "lean canvas model", "process map", "stakeholder map" and others in order to define the project as clearly as possible. After this definition of the project we have a preliminary assessment of its cost and duration. Of course, we will keep the flexibility of custom development and use the Project Management methods appropriate to each project.
Please deliver on time!
In terms of delivery, all our projects are tracked by a dedicated Project Manager and have clearly defined teams. All steps are monitored by a steering committee that meets regularly (weekly, biweekly or monthly), depending on the stage of the project. This committee is made up of representatives of the client or other parties, as well as representatives of BPnP. This committee determines whether the project is on track, according to the roadmap previously defined, or whether it will be subject to changes in implementation.
I want to see diagrams!

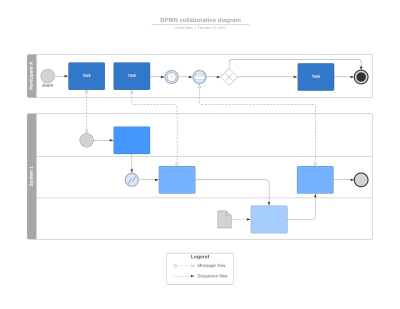
BPMN Collaborative Diagram
Collaboration diagrams consist of a collection of participants that are represented by pools. Pool interactions are represented by message flows, and can include processes within pools. Creating participants in a BPMN diagram. A pool in a BPMN model represents a participant, which can be a business entity or role.

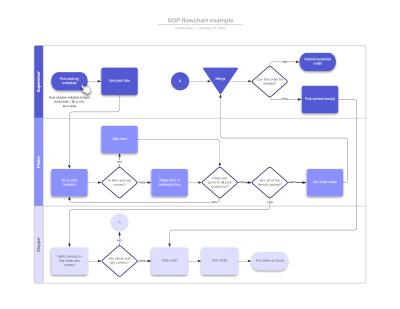
Flowchart diagram example
A flowchart is a type of diagram that represents a workflow or process. The flowchart shows the steps as boxes of various kinds, and their order by connecting the boxes with arrows. This diagrammatic representation illustrates a solution model to a given problem.

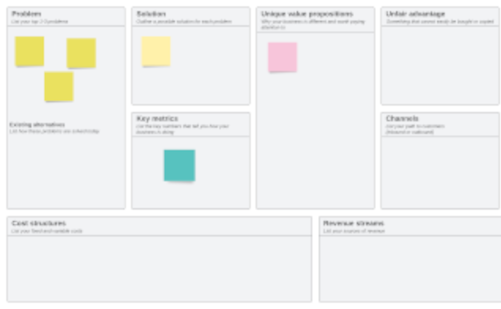
Lean canvas model example
Lean Canvas is a 1-page business plan template created by Ash Maurya that helps you deconstruct your idea into its key assumptions. It is adapted from Alex Osterwalder's Business Model Canvas and optimized for Lean Startups. It replaces elaborate business plans with a single page business model.